8 key metrics to optimize your customer experience

The customer experience is becoming a major issue for companies these days. Providing a positive customer experience can help them acquire and retain customers. Putting an enhanced customer experience in place is therefore an important point in the company’s development.
The proof is there: turnover of companies that excel in customer experience is 4% to 8% higher than the rest of the market. Another reason to invest in creating a better customer experience!
Many companies rely on the customer experience to set themselves apart from the competition. 81% of customer experience managers expect companies to stand out purely (or almost) through the customer experiences they offer.
However, improving the customer experience is a huge topic, involving both the strategic and operational sides. It is therefore a subject that requires forethought on the part of the different departments involved. INO advises its customers to start by making an inventory of communication channels and points of contact. To do this, let’s zoom in on 8 indicators to keep a close eye on, and the conclusions to be drawn from them.
1. QS or quality of service
Service quality is THE essential indicator to monitor closely. It is calculated by dividing the number of calls answered by the number of incoming calls. Generally speaking, QS is said to be excellent when it is over 95%. But don’t beat yourself up if you don’t reach that figure! To have a true understanding of your QS, consider correlating it with your reiteration rate.
2. Reiteration rate
The reiteration rate measures the proportion of customers who need to make at least one more call before getting in touch with your business. Why correlate it with QS? Simply because it allows you to weight your performance. People who try to contact you unsuccessfully sometimes (often!) try again at least a second time.
QS only shows the calls you haven’t answered, not the people you haven’t been in contact with. That’s why the repetition rate, the percentage of callers who try to reach you a second time, is important. But don’t worry if your QS is lower, because you aren’t losing out on all the people making those calls!
3. ACD or average call duration
This is a measure of conversation quality. Simply listen to recordings of conversations between advisors and clients to understand why call times are longer.
Set up a qualification questionnaire at the end of the call. The idea is to provide advisors with a qualification questionnaire so that they can express their feedback. Use open and closed questions to help you identify the irritant that lengthens call duration.
4. Call camel curve
The camel curve is a graphical representation that allows you to observe peaks and troughs of activity. It is called a camel curve because it usually contains two bumps (two peaks of activity) that represent the times when customers are most likely to call you. The camel curve should be monitored because it makes it possible to better optimize contact centre organization and better understand call spikes.
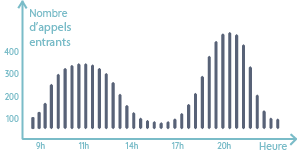
Once the camel curve is analysed, the idea is to smooth streams, shunting calls that cannot be processed during spikes to times when activity is lighter. To do this, here are the three techniques that our consultants recommend:
Advise customers of waiting time: a message to state waiting time is the first step to managing activity spikes. You just need to keep your customers informed of the estimated waiting time and advise them to call back during off-peak hours, when they are sure to reach you. This organization can help you out efficiently but is not really a long -erm solution as the customer experience is impaired.
Suggest calling them back: if the waiting time is too long, you can suggest calling the customers back at another time of the day. Even better, you can suggest your customers leave a voicemail message. That way, when your advisor processes the client’s query, they are already aware of the situation and can come back to them with solutions!
Encourage the use of self-care and call digitalization: we talk about this regularly because redirecting incoming calls to an alternative digital channel is a solution to optimize stream handling. For example, you can suggest customers continue the experience on their mobiles so that they find their answers independently, or via chat, with an advisor.
5. Connection time
Connection time should be monitored regularly. This is the time the client spends waiting before being put in touch with an advisor. Even if your QS is good, the customer experience can be impaired if your customers wait too long before being put through to someone.
It is estimated that 1 in 2 French people want to wait less than a minute on the phone. *³. hat’s quite a challenge for customer relations departments! However, if waiting times are longer than that, it is often because your teams are dealing with call spikes or that your staffing levels are inadequate.
Several solutions are available to reduce the impact of (too) long waiting times. As with smoothing out the camel curve, it is possible to set up call-back requests, to digitize some of the calls or to suggest customers leave a voice message. These solutions are good alternative actions to reduce the impact of lengthy connection times!
6. Time spent in IVR
The number of seconds or minutes spent in the Interactive Voice Response system is a key indicator when analysing customer journeys. As customers ourselves, we all know how frustrating it is to spend too much time in the IVR system.
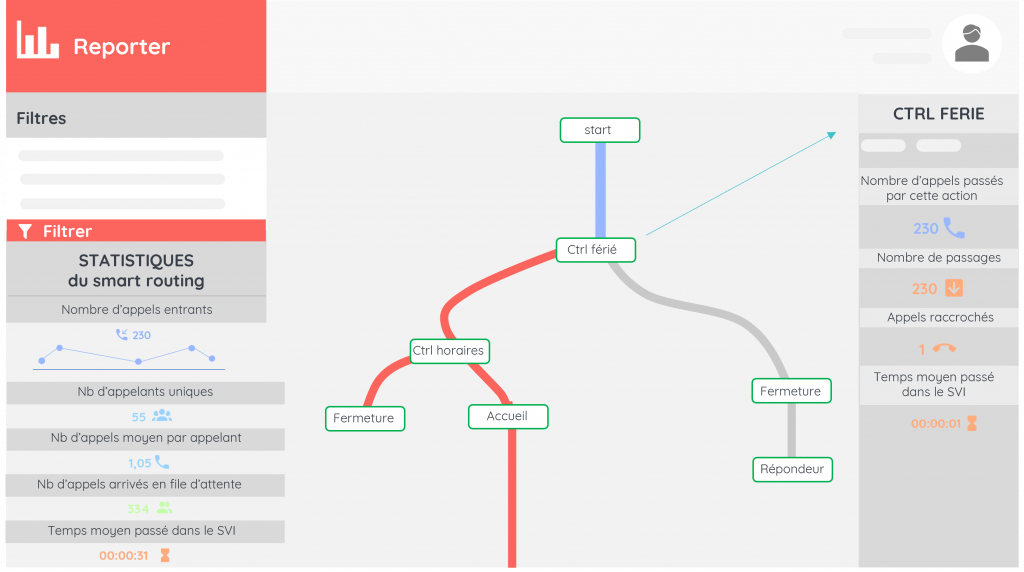
Our performance monitoring platform, Reporter, contains a module called “explore”, which will help you to better understand the customer journey irritants in IVR. This module provides a schematic view of the IVR and highlights the number of calls at each stage, the number of drop-outs at that stage and the average time taken to reach that stage.
More broadly, the observation data from “Explore” allows you to:
- Observe the amount of time a client spends in the IVR system.
- See if customers find their way, increasing your customer knowledge.
- Analyse the IVR stages where drop-outs occur.
- To measure the impact of any changes in the IVR architecture on customer behaviours.
This tool allows you to take into account all the irritants in your customer journey, so you can create easy journeys that are optimized to meet your contacts’ expectations!
7. Number of incoming calls
This is a very simple indicator, but it can help you detect an issue. This is the number of calls received by your contact centre: if the number is abnormally high or low, it is because a factor is disrupting your activities. Compare the figure to the previous week(s), month(s) and previous year to double check.
If the spike is still unexplained, put in place the same actions as for analysing reasons for longer calls: recording playback and end-of-call questionnaires.
8. Transfer rate
Often forgotten, this is a metric you should not neglect! A high transfer rate may indicate two things: either the customer journey is not optimized, or the advisors lack training. In both cases, the customer journey is disrupted because the customer does not get their answer straight away.
According to a study,only 63% of callers had their problem resolved by their first contact person. *⁴. A relatively low rate when we know that transfers diminish customer satisfaction. It is therefore essential to monitor this rate closely and to ensure that the main reasons for transfers are understood, so as to keep them to a minimum.
You are now armed and ready to monitor your customer journey’s performance. And you can now work on your strategy for improving your customers’ experience!
Did you like this article? Discover our selection!

CREATING EXCEPTIONAL CUSTOMER RELATIONSHIP
Receive our latest news directly in your inbox.

|
Thank you for Signing Up |

Creating exceptional customer relationship
Receive our latest news directly in your inbox.
| Thank you for Signing Up |